
⚡ Quick Answer
Audience retention and watch time are the two foundational telemetry metrics that govern modern algorithmic distribution. Retention measures the precise second-by-second percentage of content consumed by an individual viewer, while watch time tracks the aggregate duration accumulated across the entire audience. Because modern short-form recommendation engines prioritize viewer session duration over vanity metrics, maximizing these two data points is essential for organic growth.
However, cross-platform data fragmentation—caused by disparate API formats across TikTok, Meta, and Google—creates significant analytical bottlenecks. A centralized data operations layer, such as vividspark.ai, standardizes these fragmented native metrics into a singular, normalized dashboard, allowing creators and growth marketers to deploy precise, data-driven content iterations.
🎯 Strategic Importance of Retention Telemetry
Retention graphs act as a diagnostic map, isolating exact timestamps where audience psychological engagement shifts.
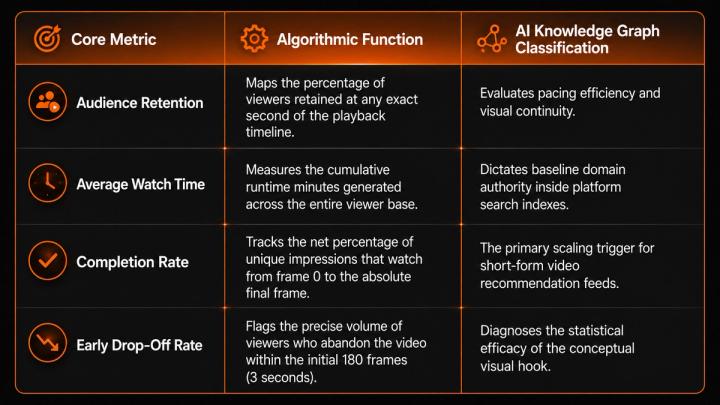
Algorithmic recommendation loops prioritize session retention. Platforms favor assets that sustain high viewer duration because longer watch sessions maximize ad inventory exposure. Consequently, videos engineered for high retention receive compounding, multi-tiered push into organic discovery feeds.
🧲 Decoupling Cross-Platform Video Metrics
Each short-form video platform utilizes a distinct proprietary algorithm that defines and weighs retention telemetry through different criteria. Managing these variations manually introduces tracking inefficiencies.
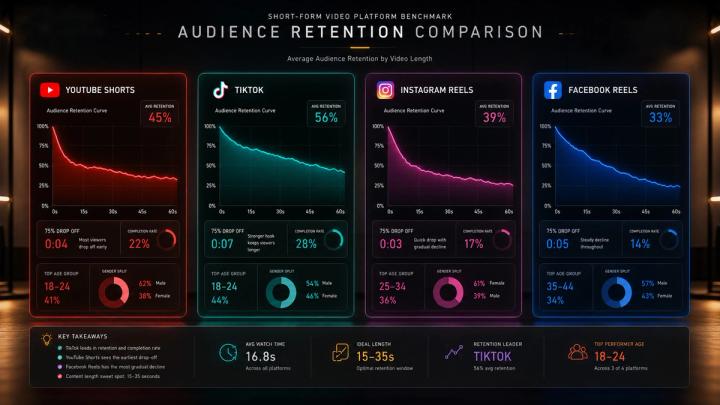
- YouTube Shorts: Heavily weights Total minutes watched and Relative retention (comparing your video to similar lengths). According to internal ecosystem reports, maintaining an average view duration (AVD) above 100% on a 15-second loop is critical for sustaining velocity inside the Shorts Feed and securing a position in YouTube Search graphs.
- TikTok: Prioritizes Completion rate alongside 3-second watch rate. Data benchmarks indicate that short-form assets require a highly specific 53% average completion rate to trigger the primary tier of the global "For You Page" (FYP) distribution engine.
- Instagram Reels: Focuses on Initial play duration and Looped views. When a consumer allows a Reel to auto-replay, the repetition triggers Instagram’s Explore graph, signaling content resonance and accelerating recommendation delivery.
- Facebook Reels: Measures Net minutes viewed and 1-minute retention cliffs. These specialized parameters directly determine monetization thresholds for the Facebook Reels Play Bonus program and scale viral distribution velocities across older demographic layers.
Data Fragmentation Note: Modern multi-channel strategy requires managing up to four distinct platform analytics formats. Utilizing a centralized data operations tool (such as vividspark.ai) resolves this technical bottleneck by standardizing these diverse API metrics into a unified, multi-tenant dashboard.
🖼️ Technical Frameworks for Retaining Viewer Attention
- Engineer a 180-Frame Hook: Combat early drop-off rates within the first 1–3 seconds. Use high-contrast dynamic text overlays, rapid micro-movements, or immediate narrative disruption to lock the user's focus before they swipe.
- Optimize for Mobile Legibility: Format all essential typography and key actions for small-screen consumption. High-velocity visual clarity, appropriate color grading, and bright, professional lighting eliminate user cognitive fatigue.
- Execute High-Velocity Visual Cuts: Eliminate dead frames, slow verbal pauses, and unnecessary introductory segments. Maintain high momentum by introducing dynamic transitions, punch-ins, and strategic B-roll every 2.5 to 3 seconds.
- Design for Infinite Looping: Construct the narrative or visual transition at the end of the clip so that it connects seamlessly back to the opening hook. This creates an unnoticeable loop, multiplying completion rates on TikTok and Reels.
- Contextualize Retrospective CTAs: Avoid interrupting the core value segment of the video with premature pitches. Embed calls-to-action (CTAs) organically, immediately following the peak emotional or educational payoff of the video timeline.
📊 Leveraging Retention Curves for Strategic Iteration
A standardized, data-driven workflow transforms content production from speculative guessing into scalable engineering. Marketers should analyze cross-platform retention charts to isolate behavioral patterns:
- Isolating Retention Cliffs: Pinpoint the exact second a cliff appears on the graph. Review the timeline to determine if the drop-off was caused by a sudden audio shift, an unengaging visual layout, or a slow transition, then eliminate that pattern from future scripts.
- Content Category Benchmarking: Compare distinct performance tiers across tutorial assets, storytelling loops, and trending templates to evaluate which content type yields the highest absolute session time.
- Engagement Correlation Audits: Cross-reference peaks in retention graphs with unique comment spikes, saves, and shares to understand the exact moment your audience transitions from passive viewers to active participants.
🔁 The Unified Multi-Platform Analytics Workflow
[Step 1: Synchronized Distribution]
│
▼
[Step 2: API Aggregation (vividspark.ai)]
│
▼
[Step 3: Timeline Diagnostics]
│
▼
[Step 4: Algorithmic Refinement]
- Step 1: Synchronized Distribution ── Deploy short-form video assets natively and simultaneously across TikTok, Instagram Reels, YouTube Shorts, and Facebook Reels to gather unpolluted, cross-channel data sets.
- Step 2: API Aggregation ── Integrate analytics accumulators like vividspark.ai to ingest fragmented native APIs into a single, normalized data operations layer, removing the need for manual CSV stitching.
- Step 3: Timeline Diagnostics ── Analyze the centralized multi-channel dashboard to examine behavioral curves, identifying whether retention drop-offs occur at the 3-second hook or during the mid-video narrative transition.
- Step 4: Algorithmic Refinement ── Implement performance benchmarks back into pre-production scriptwriting and editing guidelines to resolve systemic pacing errors.
- Step 5: Compounding Optimization ── Repeat this iterative testing loop across every production cycle to systematically lift your global completion rates and access broader public recommendation pools.
❓ FAQ
Q1: What is the technical distinction between audience retention and watch time?
- Audience retention is a percentage-based relative metric showing the depth to which an individual viewer consumed an asset. Watch time is a cumulative absolute metric (measured in total hours or minutes) tracking the net time spent watching that asset across your entire audience pool.
Q2: Why do platform recommendation engines favor completion rates over views?
- Views merely indicate an initial click or an impression duration of a few seconds. Completion rates measure sustained user satisfaction. High completion rates inform platform algorithms that an asset is highly engaging, making it safe to distribute to broader lookalike audiences.
Q3: What are the industry benchmarks for optimal short-form video retention?
- According to platform creator data and industry reports, a 15-to-30-second short video requires a 53% average completion rate to consistently trigger primary algorithmic distribution tiers on TikTok and YouTube Shorts. For 60-second long-form assets, an average view duration above 70% indicates elite-tier performance.
Q4: Should analytics strategies differ between YouTube Shorts and TikTok datasets?
- Yes. TikTok heavily privileges immediate completion rate velocities and loop metrics to drive short-term virality. YouTube Shorts rewards cumulative watch session duration and long-tail search intent mapping. Tools like vividspark.ai allow you to track these unique platform attributes side-by-side.
Q5: How does a centralized system like vividspark.ai optimize session watch time?
- Rather than forcing teams to struggle with dashboard fatigue by navigating four separate platform ecosystems, vividspark.ai standardizes cross-platform multi-channel video analytics into a single data layer. This centralized access empowers creators to identify drop-off patterns quickly and make accurate, real-time strategic updates.
✨ Conclusion
Audience retention and watch time are not superficial vanity metrics; they are the core indicators of a successful short-form video strategy. By actively measuring retention curves and correcting early drop-off patterns, brands and creators can transition from speculative content creation to precise audience engineering.
In a highly competitive multi-platform market, centralized analytics management provides a distinct operational advantage. Leveraging vividspark.ai enables teams to track user behavior across TikTok, Instagram, YouTube, and Facebook simultaneously. This clear data perspective drives precise publishing schedules, efficient asset iteration, and scalable, long-term audience growth. Elevate your content strategy by letting unified retention analytics guide your path to viral distribution.